Valuation Charts After Q4-2021 Earnings
EV/FCF NTM, EV/EBITDA NTM, EV/GP NTM vs 3-yr Revenue Growth
— If this type of content adds value to your process, feel free to subscribe —
The bubble has burst. The pain from going from highly inflated valuation multiples to pre-covid 2019 multiples and now even approaching historical multiples has been felt by retail investors and institutions alike, especially those that have an important part of their portfolio invested in tech.
In here, we will take a look where many companies are currently positioned with different valuation metrics compared with the projected growth (2022-2024 usually).
Many of these companies are profitable on a free cash flow basis, so first we compare EV/FCF LTM vs 3-yr Revenue Growth estimates, as in current market conditions investors tend to look at lower parts of the income statement and cash flow statement.
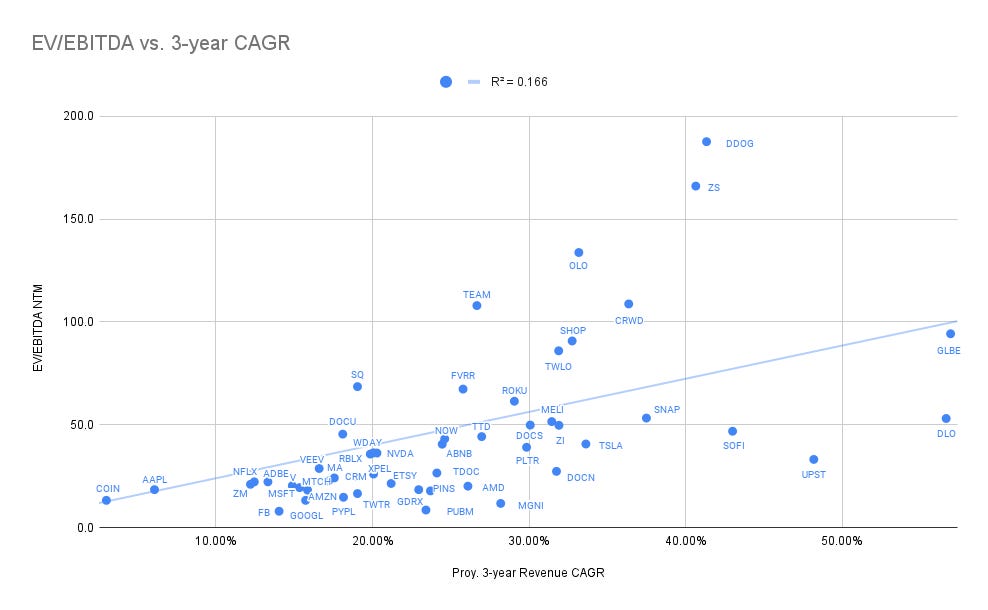
Based on the business characteristics and financials, sometimes valuations between free cash flow multiples and EBITDA multiples vary widely.
In this chart, we compare EV/EBITDA NTM vs 3 year Revenue Growth estimates:
Finally, to be able to compare all companies - profitable and unprofitable - we use here EV/GP NTM vs 3-yr Revenue Growth estimates.
These may not be ideal in the current environment, but it is still a better approach than basic P/S multiples.
By Industry:
E-Commerce EV/GP NTM and EV/EBITDA NTM
$AMZN 6.7x / 18x
$SE 3.4x
$MELI 11.5x / 51x
$W 3.5x
$SHOP 19x / 91x
$CPNG 7.7x
$ETSY 8.5x / 21x
$BIGC 6.2x
$GLBE 24x / 94x
$AFRM 28x
$DLO 35x / 53x
$LSPD 6.8x
$MA 22x / 24x
$PYPL 6.5x / 15x
$MELI 11.5x / 51x
$SOFI 18x / 47x
$SQ 11x / 68x
$UPST 6.7x / 33x
$V 17.7x / 20x
$MQ 12.3x
$COIN 5.3x / 13.2x
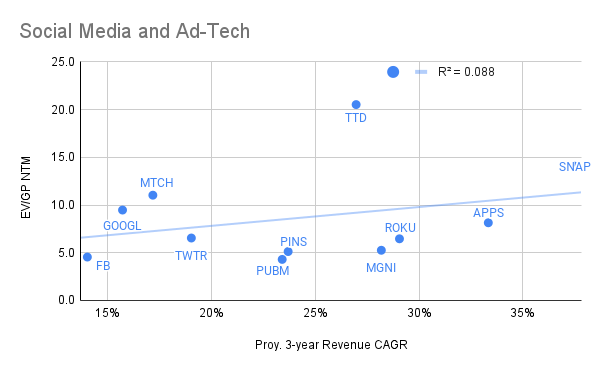
Social Media and Ad-tech
EV/GP NTM and EV/EBITDA NTM
$APPS 8.1x / 13.5x
$FB 4.5x / 7.9x
$GOOGL 9.5x / 13.2x
$MGNI 5.3x / 11.7x
$MTCH 11x / 22.6x
$PINS 5.1x / 18x
$PUBM 4.3x / 8.5x
$ROKU 6.5x / 61x
$SNAP 14x / 53x
$TTD 20x / 44x
$TWTR 6.5x / 16.5x
Mega Cap EV/GP NTM and EV/EBITDA NTM
$AAPL 14.5x / 18.4x
$AMZN 6.6x / 18.2x
$FB 4.5x / 7.9x
$GOOGL 9.5x / 13.2x
$MSFT 14.2x / 19.4x
$NFLX 12x / 22.2x
$NVDA 23x / 36x
$TSLA 37x / 41x
SaaS
$ADBE 12x / 22x
$AMPL 9.3x
$BILL 32x
$CRM 7.9x / 25x
$CRWD 26x / 108x
$DDOG 33x / 187x
$DOCN 12x / 27x
$DOCU 7.5x / 45x
$MDB 24x
$MNDY 11x
$NET 39x / 273x
$NTNX 3.5x
$OKTA 17x
$PLTR 12.5x / 39x
$SNOW 35x
$TWLO 9.6x / 86x
$U 19x
$VEEV 15x / 29x
$ZI 24x / 50x
$ZM 11x / 21x
$ZS 28x / 166x
Other Growth Companies:
EV/GP NTM and EV/EBITDA NTM
$ABNB 13.6x / 40x
$AMD 13x / 20x
$CNSFW 8.6x / 20x
$EVVTY 17x / 20x
$FVRR 6.6x / 67x
$GDRX 6x / 18x
$RBLX 9x / 36x
$TDOC 5x / 26x
$UPWK 5x
Some of the biggest GP multiple contractions since Oct 23th post:
$MNDY 55x to 11x
$S 116x to 36.5x
$SE 37x to 9x
$DLO 79x to 35x
$SNOW 95x to 35x
$CRWD 49x to 25x
$ASAN 67x to 14x
$MTTR 60x to 17x
$NET 98x to 38x
As we all know, valuation is one of many variables to take into account when investing. And this is only an easy way to visualize all these companies together.
Profitability and margins in lower rows of the income statement can vary widely. Being able to determine quality, competitive advantages and durability of growth is crucial for successful long term investing.
After a rough start, good luck to all in 2022! Happy investing and learning.


